OpenLayers
Feature Frenzy
M. Jansen, terrestris & A. Hocevar, w3geo
FOSSGIS 2023 | 15. März 2023 | Berlin
… was in den nächsten 20 Mins passiert
- Kurz zu uns und dem Vortrag
- OpenLayers in 120 Sekunden
- Feature Frenzy
- Ausblick, oder: Was ist in
ol@x.y.z?
(kurz) Meta
Marc Jansen / terrestris
- Geschäftsführer terrestris
- Kernentwickler & PSC OpenLayers
- GeoExt, SHOGun, GeoStyler …
- Sprecher & Trainer
national & international - OSGeo Foundation Charter Member
Andreas Hocevar / w3geo
- Geschäftsführer w3geo
- Derzeit aktivster OpenLayers Entwickler
- Proj4.js, ol-mapbox-style, geotiff.js …
- Geospatial Expert
- JavaScript Entwickler aus Leidenschaft
OpenLayers ist
- eine Web Mapping Library
- in JavaScript
- für Browser und teilweise für Node.js
- Open Source (BSD 2-clause)
- und hat eine aktive Community
OpenLayers kann
- beliebige (Geo-)Daten zu Karten machen
- bei Analysen beliebiger (Geo-)Daten unterstützen
- gängige Datenformate out-of-the-box
- sonstige Formate mit wenig Code
- und vieles mehr
OpenLayers ist im Vergleich zu
- Leaflet: umfrangreicher, schwerer zu lernen
- MapLibre/Mapbox GL JS: flexibler, langsamer
- ArcGIS Maps SDK: ohne Vendor Lock-in
Feature Frenzy
OGC Standards
- WMS, WFS, GML - seit jeher
- WMTS - seit langer Zeit
- OGC API Tiles (Map und Vector)
- OGC API Styles (Mapbox)
- OGC API Features - teilweise
OGC API Tiles (Vector)
const layer = new TileLayer({
	declutter: true,
	source: new OGCVectorTile({
	  url: './ogcapi/collections/countries/tiles/WebMercatorQuad',
	  format: new MVT()
	})
});
Kein Style??? 😕
OGC API Styles (Mapbox)
import { applyStyle } from 'ol-mapbox-style';

applyStyle(layer, './ogcapi/collections/countries/styles/default.json');
Bessere Kartographie geht nicht??? 😕
basemap.de mit ol-mapbox-style 🚀
import { apply } from 'ol-mapbox-style';

apply(
	'map',
	'https://sgx.geodatenzentrum.de/gdz_basemapde_vektor/styles/bm_web_top.json'
);
So kann man auch, muss man aber nicht 😱
var center = [10, 51];
const mbMap = new mapboxgl.Map({
	style: 'https://sgx.geodatenzentrum.de/gdz_basemapde_vektor/styles/bm_web_top.json',
	center: center,
	container: 'map',
});
const mbLayer = new Layer({
	render(frameState) {
		const canvas = mbMap.getCanvas();
		const viewState = frameState.viewState;
		mbMap.jumpTo({
			center: toLonLat(viewState.center),
			zoom: viewState.zoom - 1,
			animate: false
		});
		return canvas;
  }
});
const map = new Map({
	layers: [mbLayer],
	target: 'map',
	view: new View({
		center: fromLonLat(center),
		zoom: 6
	})
});
Räumliche Analyse
- Eingebaute Vektor- und Rasteranalysefunktionen
- Kombinierbar mit Turf.js, geotiff.js, ...
- Analytische und grafische Ansätze möglich
- Elemente zur interaktiven Benutzerführung
- Die Möglichkeiten sind fast grenzenlos!
Zeig mir wie! 🤔

Image Tiles mit beliebigen Daten befüllen
const canvas = document.createElement('canvas');
const context = canvas.getContext('2d');

layer.setTileLoadFunction(async (tile, src) => {
	const tileCoord = tile.getTileCoord();
	const extent = tileGrid.getTileCoordExtent(tileCoord);
	const resolution = tileGrid.getResolution(tileCoord[0])
	const tileSize = tileGrid.getTileSize(tileCoord[0]);
	canvas.width = tileSize;
	canvas.height = tileSize;
	const {gradientImageData} =
	  await getGradientData(extent, tileSize, tileSize, resolution);
	context.putImageData(gradientImageData, 0, 0);
	tile.getImage().src = canvas.toDataURL('image/png');
};
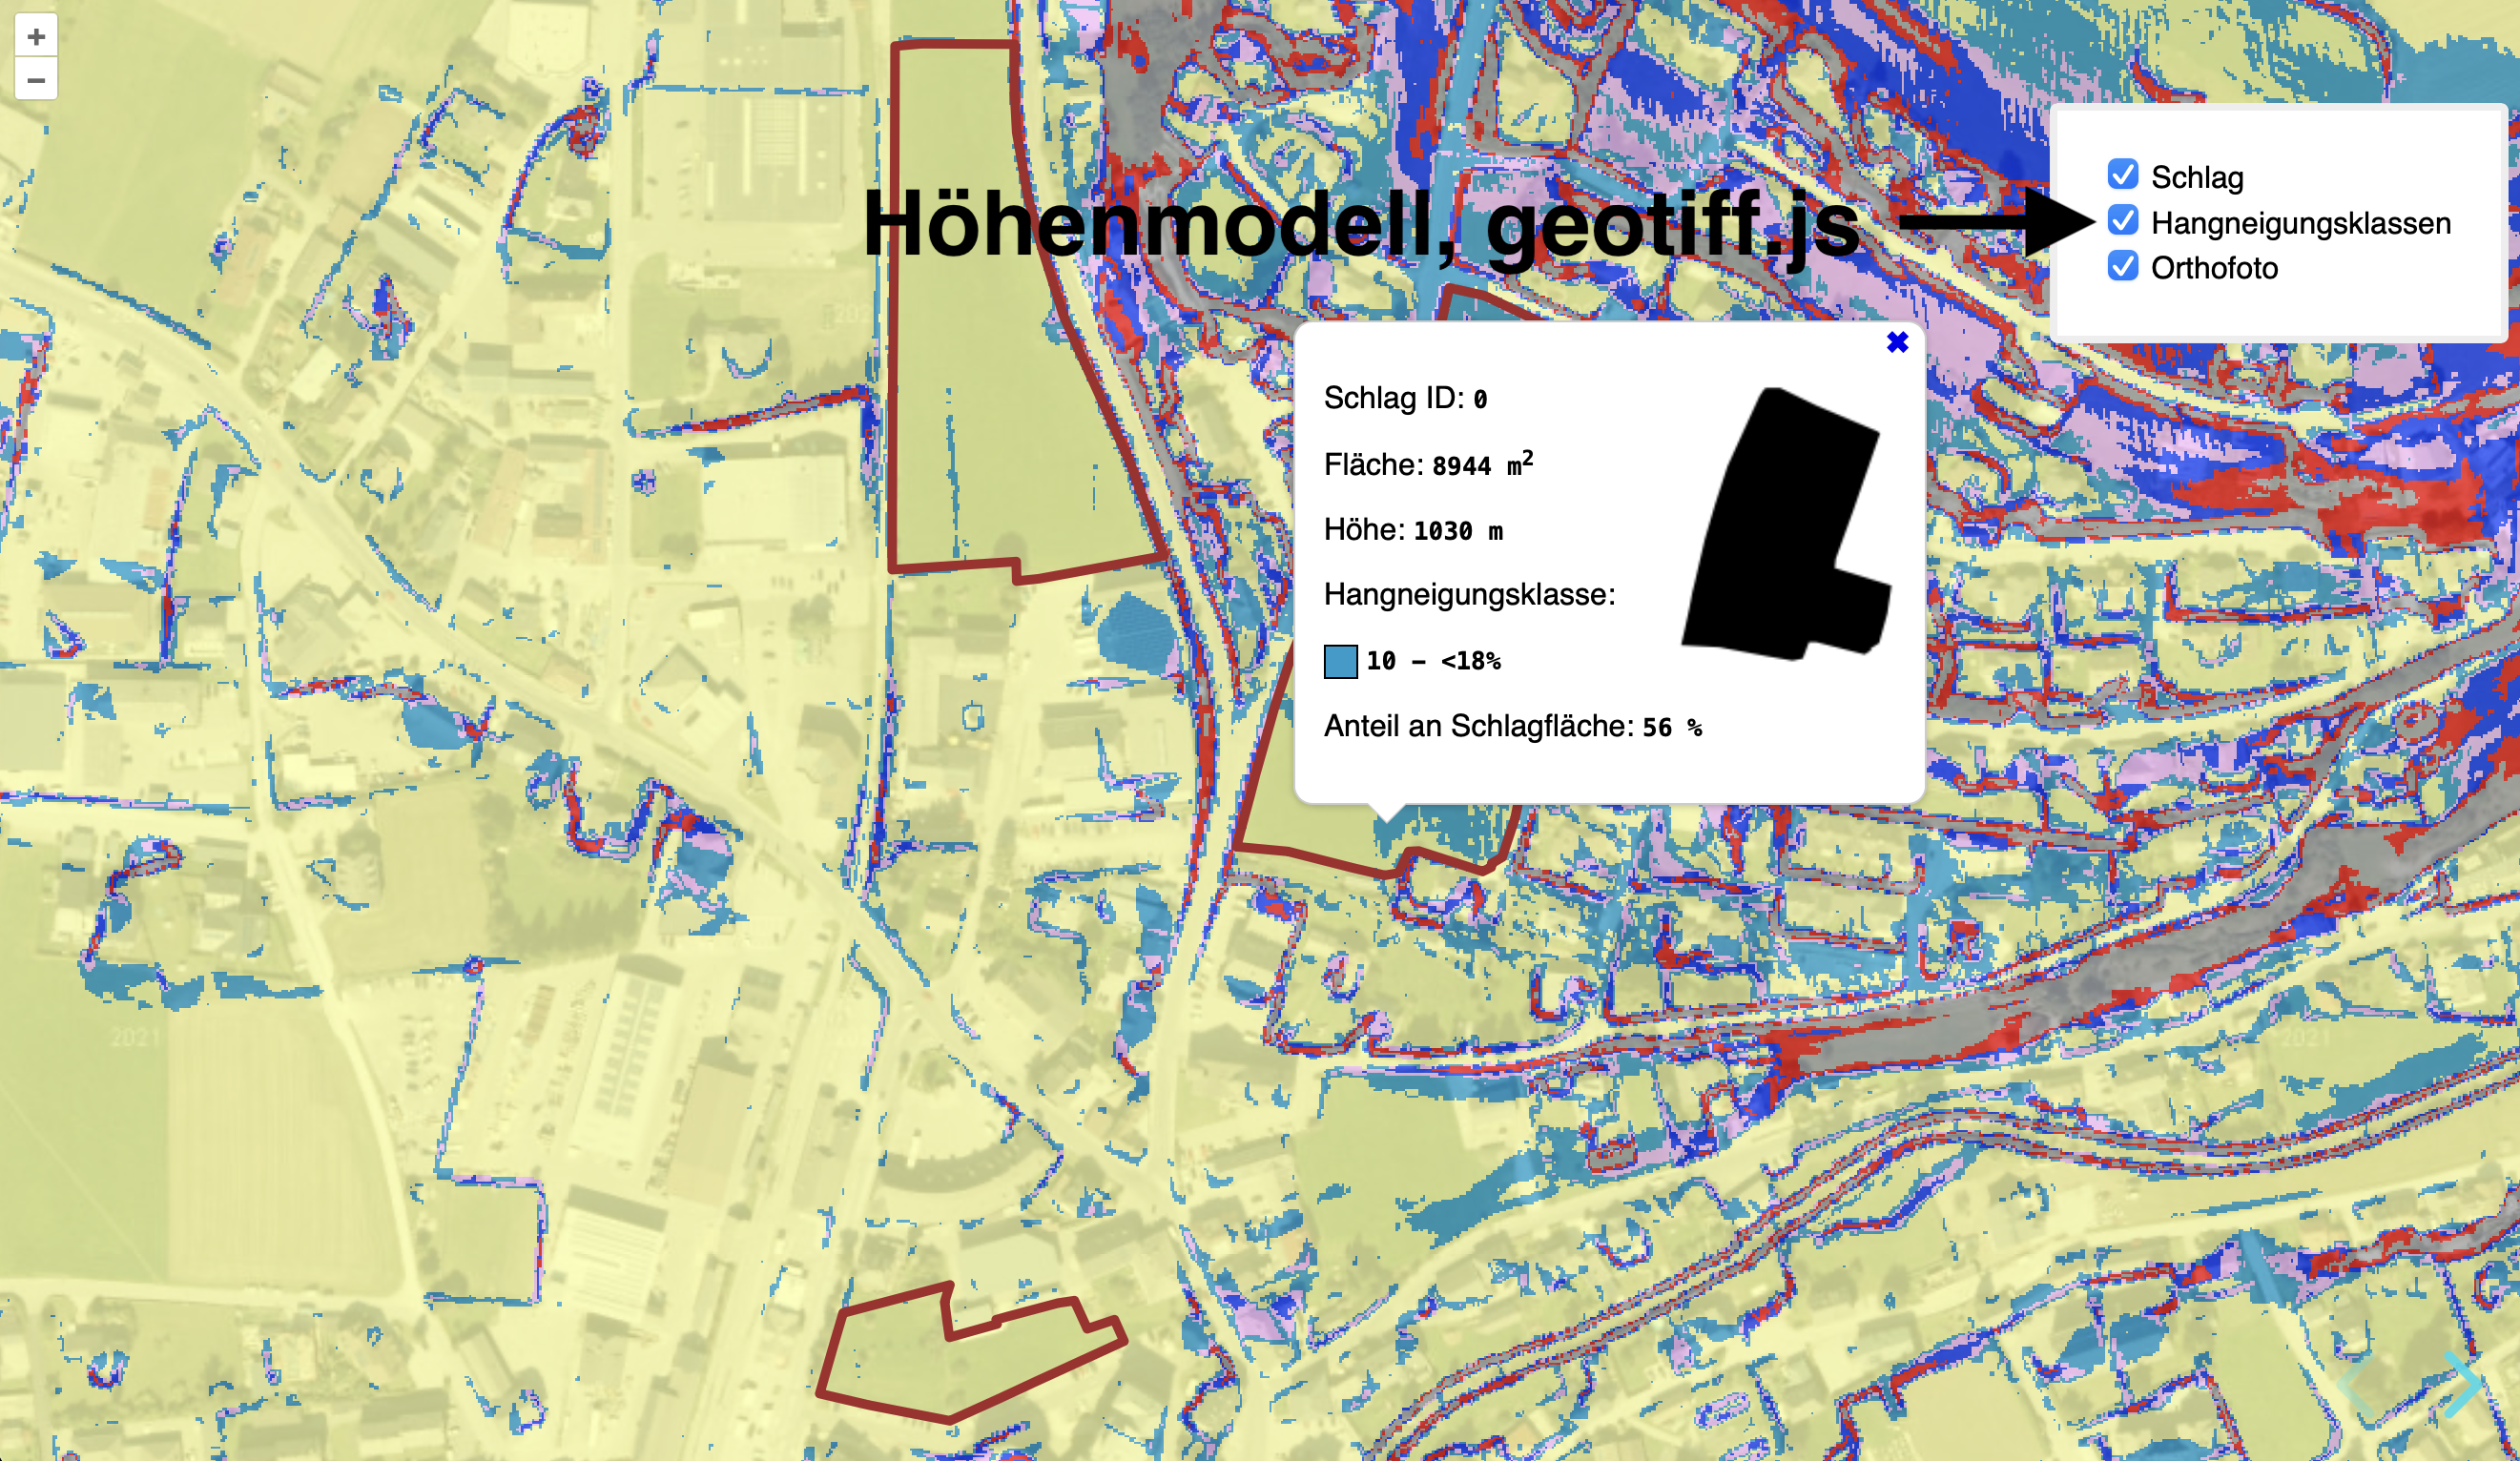
Höhenmodell zu Hangneigungsklassen
async function getGradientData(bbox, width, height, resolution) {
	// Höhen aus dem geotiff laden
  const dtm = (await geotiff.readRasters({ bbox, width, height }))[0];
  const gradientData = new Uint8ClampedArray(width * height);
	// befüllen mit den Hangneigungsklassen
	// https://pro.arcgis.com/en/pro-app/2.9/tool-reference/spatial-analyst/how-slope-works.htm
  const gradientImageData = context.createImageData(width, height);
	// befüllen mit Farben für Hangneigungsklassen
  return {gradientData, gradientImageData};
}

Headless Map
const target = document.createElement('div');
const headlessMap = new Map({
	target,
	pixelRatio: 1,
	layers: [new VectorLayer({ source: selected, style: blackFill })],
	view: new View({
		resolution: 1,
		center: getCenter(geomExtent)
	})
});
headlessMap.setSize([getWidth(geomExtent), getHeight(geomExtent)]);
headlessMap.renderSync();
const imageURL = target.querySelector('canvas').toDataURL('image/png');

Verschneidung Hangneigungsklasse - Schlag
for (let y = 0; y < height; y++) {
	for (let x = 0; x < width; x++) {
		const maskPixel = schlagImageData.slice(4 * (y * width + x), 4);
		const alpha = maskPixel[3] / 255;
		if (alpha > 0) {
			const area = resolution * resolution * alpha;
			classes[gradientData[y * width + x]] += area;
		}
	}
}
Tracing
const drawInteraction = new Draw({
	type: 'Polygon',
	source: drawVector.getSource(),
	trace: true,
	traceSource: baseVector.getSource(),
	style: {
		'stroke-color': 'rgba(255, 255, 100, 0.5)',
		'stroke-width': 1.5,
		'fill-color': 'rgba(255, 255, 100, 0.25)',
		'circle-radius': 6,
		'circle-fill-color': 'rgba(255, 255, 100, 0.5)',
	},
});
Rasterstyle
const classes = {
	'10': 'forest',
	'20': 'low vegetation',
	'30': 'water',
	'40': 'built-up',
	'50': 'bare soil',
	'60': 'agriculture'
}
Rasterstyle
// band 1 is 2020, band 2 is 2016
{
	color: [
		'case',
		['==', ['band', 1], ['band', 2]],
		[0, 0, 0, 0], // equal, make them transparent
		['all', ['==', ['band', 1], 10], ['!=', ['band', 2], 10] ],
		[30, 240, 0, 1], // wald in 2020, irgendwas nicht waldiges in 2016
		['all', ['==', ['band', 2], 10], ['!=', ['band', 1], 10] ],
		[240, 10, 0, 1], // wald in 2016, irgendwas nicht waldiges in 2020
		['all', ['==', ['band', 1], 40], ['!=', ['band', 2], 40] ],
		[255, 255, 255, 1], // built-up in 2020, irgendwas nicht built-up in 2016
		[0, 0, 0, 0] // hide any other differences
	]
}
2 × ca. 450 MB => 900 MB
12 × ca. 66kB=> ca. 800 kB
…und das skaliert ganz wunderbar…
PMTiles
- 30.543.645.671 Bytes (28G)

PMTiles
Fließender Übergang zum Ausblick

Caveat & WIP: Particle Flow
Caveat & WIP: Particle Flow, #14491
inspired by WebGL-Wind Map / MapBox, V. Agafonkin
Ausblick
- Mehr WebGL (eigener Vortrag)
- It's always been you, Canvas 2D - Offscreen Canvas!
- Web Workers
- STAC
- ...
- Mature Library - keine fixe Roadmap
- Interessen und Contributions bestimmen die Richtung
- OpenLayers Sponsoring für Code Sprints etc.
- Entwickler Sponsoring für Maintenance & Features
Danke!
Fragen oder Anmerkungen?
Impressum
Autoren & Kontakt
Marc Jansen
terrestris GmbH & Co. KG
Kölnstr. 99
53111 Bonn
Deutschland
jansen@terrestris.de
Andreas Hocevar
w3geo GmbH
Seidengasse 46
1070 Wien
Österreich
ahocevar@w3geo.at
terrestris GmbH & Co. KG
Kölnstr. 99
53111 Bonn
Deutschland
jansen@terrestris.de
Andreas Hocevar
w3geo GmbH
Seidengasse 46
1070 Wien
Österreich
ahocevar@w3geo.at
Lizenz
Diese Folien sind unter CC BY-SA veröffentlicht.


