ol-describe-map
Mehr Web-Accessibility für OpenLayers Karten
Marc Jansen, terrestris
FOSSGIS 2024 | 20. März 2024 | Hamburg

Über was ich sprechen möchte
- Ausgangslage
ol-describe-map- Beispiele
- Fazit & Ausblick
Ein zufällig ausgewähltes, vielleicht repräsentatives, gut aussehendes und vielfältiges WebGIS / Geoportal
Ausgangslage
- Kartenanwendungen im Web sind …
- visuelle Hingucker,
- voller Funktionalität, und
- vielleicht bzgl. Barrierearmut optimierbar?
- Kernaspekte: Visualisierung und Interaktion…
- …ist damit ein gewisses Maß an Barrieren inhärent?
Kann man etwas generisches entwickeln, was erweiterbar ist, aber auch out-of-the-box die A11y-Situation verbessert?
ol-describe-map
- Mini-Bibliothek für OpenLayers
- Erzeugt eine textuelle Beschreibung einer OpenLayers Karte (View und Layer)
- Setzt ARIA-Attribute in HTML-Element
- Auch für SEO nützlich
- https://github.com/terrestris/ol-describe-map
- https://www.npmjs.com/package/@terrestris/ol-describe-map
- jung, konfigurierbar & erweiterbar

Trivialer geht's kaum
// import the describe function
import { describe } from '@terrestris/ol-describe-map';

// create an OpenLayers map (left out for brevity), then:
let desc = await describe(map);
// …will also update ARIA attributes behind the scenes

// call as often as you think is necessary
// e.g. on certain map-events, or scheduled
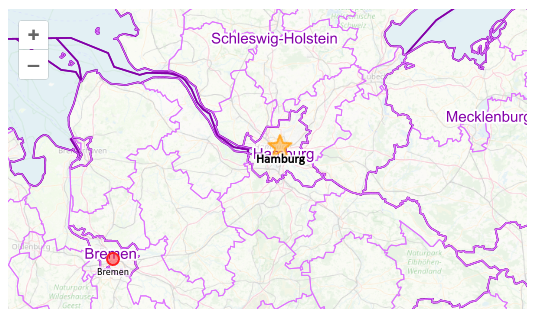
The map is centered at Hamburg, 21129, Germany. The lower left of the visible map extent is at Cloppenburg district, Lower Saxony, Germany. In the upper left corner of the visible extent, Schleswig-Holstein, Germany is located. Landkreis Rostock, Mecklenburg-Vorpommern, Germany is in the upper right corner of the map. The lower right corner of the map shows Stendal, Saxony-Anhalt, Germany. Place determination uses a Nominatim service from terrestris – https://nominatim.terrestris.de/ –, based on data from the OpenStreetMap project, © OpenStreetMap contributors.The map contains 3 layers. The first layer is a tile-layer (pre-rendered, tiled images in grids organized by zoom levels). It uses an OpenStreetMap-source as source for it's data. This layer is the lowest in the drawing order, other layers are drawn atop of it. The second layer is an image-layer (server-rendered & for arbitrary extents and resolutions). It uses an ImageWMS-source as source for it's data. This layer is a composition of 3 layers, those are: "vg5000_krs" (title/abstract: "Kreis"), "vg5000_rbz" (title/abstract: "Regierungsbezirk"), "vg5000_lan" (title/abstract: "Bundesland"). The third layer is a vector-layer (vector data that is rendered client-side). It uses a Vector-source as source for it's data. The layer source contains 2,054 features. A total number of 103 (5.01%) intersect with the current map-extent; actually rendered were 2 (1.94%) features. From the rendered features basic statistical information for the following properties can be obtained: 'pop', 'area'. Property 'pop': the minimal value is 566,573 (feature named 'Bremen') while the maximum value is 1,845,229 (for the feature with name 'Hamburg'). The average value is 1,205,901 and the sum is 2,411,802. Property 'area': the minimal value is 326.73 (feature named 'Bremen') while the maximum value is 755.22 (for the feature with name 'Hamburg'). The average value is 540.975 and the sum is 1,081.95. This layer is top-most in the drawing order.
Ausblick
- Feedback echter Nutzer mit z.B. Sehbehinderungen, bzw. zur Informationsmenge
aria-description/aria-detail/aria-describedby?- Mehr OGC API Support
- KI ?
- Nutzung in der Praxis
- Feedback, Ideen, Kritik usw.? Gerne mitmachen!
Danke!
Fragen oder Anmerkungen?
… bitte am terrestris Stand :-)
Impressum
Autor & Kontakt
Lizenz
Diese Folien sind unter CC BY-SA veröffentlicht.
