Create a feature grid
Now it's time to change the grid to no longer show static data from The Simpsons, but instead one row for every feature of the vector layer.
Exercises
- Please set up
src/map.htmlto contain the following lines:
<!DOCTYPE html>
<html>
    <head>
        <meta charset="utf-8">
        <title>Exercise | GeoExt Workshop</title>
        <link rel="stylesheet" href="https://cdnjs.cloudflare.com/ajax/libs/extjs/6.0.0/classic/theme-triton/resources/theme-triton-all.css" type="text/css">
        <script src="https://cdnjs.cloudflare.com/ajax/libs/extjs/6.0.0/ext-all.js" type="text/javascript"></script>
        <link rel="stylesheet" href="./lib/ol/ol.css" type="text/css">
        <script src="./lib/ol/ol.js" type="text/javascript"></script>
        <script src="https://geoext.github.io/geoext3/master/GeoExt.js" type="text/javascript"></script>
    </head>
    <body>
        <script>
var map;
Ext.onReady(function(){
    var redStyle = new ol.style.Style({
        image: circle = new ol.style.Circle({
            fill: new ol.style.Fill({
                color: 'rgba(220, 0, 0, 0.5)'
            }),
            stroke: new ol.style.Stroke({
                color: 'rgba(220, 0, 0, 0.8)',
                width: 3
            }),
            radius: 8
        })
    })
    var vectorLayer = new ol.layer.Vector({
        source: new ol.source.Vector({
            url: 'data/aimag-centers.json',
            format: new ol.format.GeoJSON()
        }),
        name: 'Aimag',
        style: redStyle
    });
    // 1) OpenLayers
    //
    // Create an instance of an OpenLayers map:
    map = new ol.Map({
        layers: [
            new ol.layer.Tile({
                source: new ol.source.OSM(),
                name: 'OpenStreetMap'
            }),
            new ol.layer.Tile({
                source: new ol.source.TileWMS({
                    url: 'http://ows.terrestris.de/osm/service',
                    params: {
                        layers: 'OSM-WMS'
                    }
                }),
                name: 'OSM WMS (terrestris)'
            }),
            vectorLayer
        ],
        view: new ol.View({
            center: ol.proj.fromLonLat( [106.92, 47.92] ),
            zoom: 4
        })
    });

    // 2) GeoExt
    //
    // Create an instance of the GeoExt map component with that map:
    var mapComponent = Ext.create('GeoExt.component.Map', {
        map: map,
        region: 'center'
    });

    var treeStore = Ext.create('GeoExt.data.store.LayersTree', {
        layerGroup: map.getLayerGroup()
    });

    var layerTreePanel = Ext.create('Ext.tree.Panel', {
        title: 'Layers of the application',
        width: 300,
        region: 'west',
        store: treeStore,
        rootVisible: false,
        viewConfig: {
            plugins: { ptype: 'treeviewdragdrop' }
        }
    });

    var featureStore = Ext.create('Ext.data.Store', {
        fields:[ 'name', 'email', 'phone'],
        data: [
            { name: 'Lisa', email: 'lisa@simpsons.com', phone: '555-111-1224' },
            { name: 'Bart', email: 'bart@simpsons.com', phone: '555-222-1234' },
            { name: 'Homer', email: 'homer@simpsons.com', phone: '555-222-1244' },
            { name: 'Marge', email: 'marge@simpsons.com', phone: '555-222-1254' }
        ]
    });

    var featurePanel = Ext.create('Ext.grid.Panel', {
        title: 'Simpsons',
        store: featureStore,
        columns: [
            { text: 'Name', dataIndex: 'name' },
            { text: 'Email', dataIndex: 'email', flex: 1 },
            { text: 'Phone', dataIndex: 'phone' }
        ],
        height: 200,
        region: 'south'
    });

    // 3) Ext JS
    //
    // Create a viewport
    var vp = Ext.create('Ext.container.Viewport', {
        layout: 'border',
        items: [
            mapComponent,
            layerTreePanel,
            featurePanel
        ]
    });
});
        </script>
    </body>
</html>
- Instead of a generic
Ext.data.Store, use aGeoExt.data.store.Features. Look up the API documentation on http://geoext.github.io/geoext3/master/docs for further details. - Make sure you reference your vector layer and the map to work on when configuring the store.
- Next we need to configure the
columnsof theExt.grid.Panel. Look up the attributes of the GeoJSON and change the appropriate configuration in the config object for theExt.grid.Panel.
- Additionally we can use the
GeoExt.grid.column.Symbolizerclass of GeoExt to include the styling of the feature in the grid. Add the following line to your columns definition:
{xtype: 'gx_symbolizercolumn', width: 30}
- When a row is selected in the grid, it is visually highlighted. Wouldn't it be nice if the feature on the map would also have a different style once its associated row is selected?
- Assign a
selectionchangelistener on the grid and ensure that the correct feature is highlighted in the map. Hint: Create a new style and in the callback reset the style for every feature and reassign the new style to the to the currently selected feature. Useconsole.log(arguments)to see what you have been passed and how you can get the feature from the passed arguments. - Bonus: Once the feature has a different style on the map, it would be nice if we could see that style in the grid, right? Change the
selectionchangelistener to also update the grid once the style of the feature has changed.
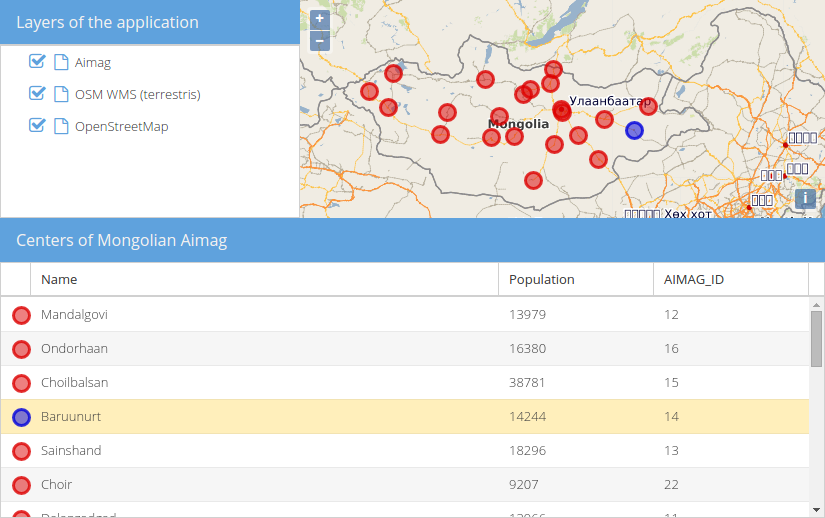
- Your application should now roughly look like depicted below: