Drawing Features
New features can be drawn by using an ol.interaction.Draw. A draw interaction is constructed with a vector source and a geometry type.
Create a Vector Layer and a Draw Interaction
Tasks
- Let's start with the example below. Open
map.htmlin your text editor and make sure it looks something like the following:<!doctype html> <html lang="en"> <head> <link rel="stylesheet" href="/ol.css" type="text/css"> <style> #map { height: 256px; width: 512px; } </style> <script src="/loader.js" type="text/javascript"></script> <title>OpenLayers 3 example</title> </head> <body> <h1>My Map</h1> <div id="map"></div> <script type="text/javascript"> var source = new ol.source.Vector({ url: '/data/layers/7day-M2.5.json', format: new ol.format.GeoJSON() }); var draw = new ol.interaction.Draw({ source: source, type: 'Point' }); var map = new ol.Map({ interactions: ol.interaction.defaults().extend([draw]), target: 'map', layers: [ new ol.layer.Tile({ title: 'Global Imagery', source: new ol.source.TileWMS({ url: 'http://demo.opengeo.org/geoserver/wms', params: {LAYERS: 'nasa:bluemarble', VERSION: '1.1.1'} }) }), new ol.layer.Vector({ title: 'Earthquakes', source: source, style: new ol.style.Style({ image: new ol.style.Circle({ radius: 5, fill: new ol.style.Fill({ color: '#0000FF' }), stroke: new ol.style.Stroke({ color: '#000000' }) }) }) }) ], view: new ol.View({ projection: 'EPSG:4326', center: [0, 0], zoom: 1 }) }); </script> </body> </html> - Save your changes to
map.htmland open the page in your browser: http://terrestris.github.io/momo3-ws//map.html. To see drawing of point geometries in action, click in the map to add a new feature: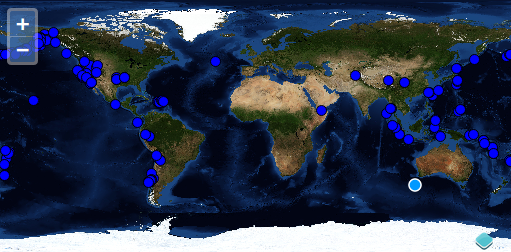
Bonus Tasks
- Create a listener which gets the new feature's X and Y after it is drawn.
Solutions
Here is a solution for the first bonus task. In it we register an event listener for the drawend event of the ol.interaction.Draw. This method logs the feature's X and Y to the developer console:
draw.on('drawend', function(evt){
  var feature = evt.feature;
  var p = feature.getGeometry();
  console.log(p.getCoordinates());
});