Prepare layout
We want to add a grid panel to our basic map application now.
Exercises
- Prepare the
map.htmlfile to contain the following code. This is basically the result of the previous chapters:
<!DOCTYPE html>
<html>
    <head>
        <meta charset="utf-8">
        <title>Exercise | GeoExt Workshop</title>
        <link rel="stylesheet" href="https://cdnjs.cloudflare.com/ajax/libs/extjs/6.0.0/classic/theme-triton/resources/theme-triton-all.css" type="text/css">
        <script src="https://cdnjs.cloudflare.com/ajax/libs/extjs/6.0.0/ext-all.js" type="text/javascript"></script>
        <link rel="stylesheet" href="./lib/ol/ol.css" type="text/css">
        <script src="./lib/ol/ol.js" type="text/javascript"></script>
        <script src="https://geoext.github.io/geoext3/master/GeoExt.js" type="text/javascript"></script>
    </head>
    <body>
        <script>
var map;
Ext.onReady(function(){
    // 1) OpenLayers
    //
    // Create an instance of an OpenLayers map:
    map = new ol.Map({
        layers: [
            new ol.layer.Tile({
                source: new ol.source.OSM(),
                name: 'OpenStreetMap'
            }),
            new ol.layer.Tile({
                source: new ol.source.TileWMS({
                    url: 'http://ows.terrestris.de/osm/service',
                    params: {
                        layers: 'OSM-WMS'
                    }
                }),
                name: 'OSM WMS (terrestris)'
            })
        ],
        view: new ol.View({
            center: ol.proj.fromLonLat( [106.92, 47.92] ),
            zoom: 12
        })
    });

    // 2) GeoExt
    //
    // Create an instance of the GeoExt map component with that map:
    var mapComponent = Ext.create('GeoExt.component.Map', {
        map: map,
        region: 'center'
    });

    var treeStore = Ext.create('GeoExt.data.store.LayersTree', {
        layerGroup: map.getLayerGroup()
    });

    var layerTreePanel = Ext.create('Ext.tree.Panel', {
        title: 'Layers of the application',
        width: 300,
        region: 'west',
        store: treeStore,
        rootVisible: false,
        viewConfig: {
            plugins: { ptype: 'treeviewdragdrop' }
        }
    });

    // 3) Ext JS
    //
    // Create a viewport
    var vp = Ext.create('Ext.container.Viewport', {
        layout: 'border',
        items: [
            mapComponent,
            layerTreePanel
        ]
    });
});
        </script>
    </body>
</html>
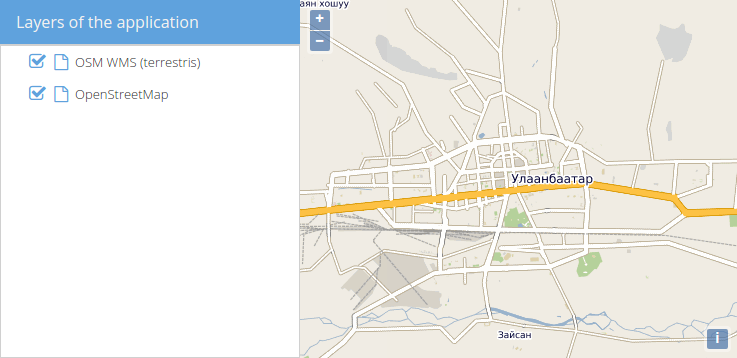
- If you open this file in a browser (/map.html), the application should look like in the following image:
- We want to have a grid in the south, so let's start with the basic example from the ExtJS Grid documentation:
Ext.create('Ext.data.Store', {
    storeId: 'simpsonsStore',
    fields:[ 'name', 'email', 'phone'],
    data: [
        { name: 'Lisa', email: 'lisa@simpsons.com', phone: '555-111-1224' },
        { name: 'Bart', email: 'bart@simpsons.com', phone: '555-222-1234' },
        { name: 'Homer', email: 'homer@simpsons.com', phone: '555-222-1244' },
        { name: 'Marge', email: 'marge@simpsons.com', phone: '555-222-1254' }
    ]
});

Ext.create('Ext.grid.Panel', {
    title: 'Simpsons',
    store: Ext.data.StoreManager.lookup('simpsonsStore'),
    columns: [
        { text: 'Name', dataIndex: 'name' },
        { text: 'Email', dataIndex: 'email', flex: 1 },
        { text: 'Phone', dataIndex: 'phone' }
    ],
    height: 200,
    width: 400,
    renderTo: Ext.getBody()
});
- Instead of using a
storeIdand then laterExt.data.StoreManager.lookup('simpsonsStore'), we will simply use a variable to be able to reference the store. Since we will put the panel in our border layout, we do not need therenderToandwidthproperties. Don't forget to assign theregion: south. We'll also save the panel in a variable. Your code should look roughly like the following:
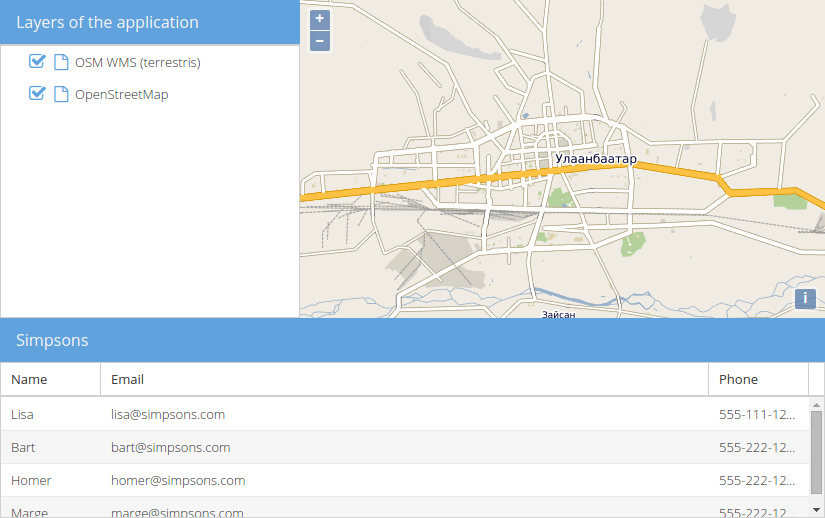
- Once we have added the
featurePanelto the viewport, our application should look like in the following image:
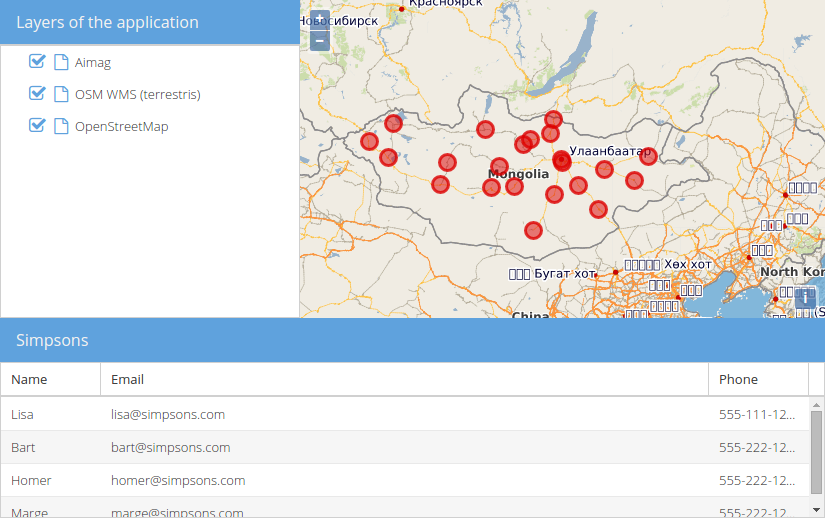
- Of course we also want to have a vector layer in the map, whose features we want in the grid later.
- Please create a new
ol.layer.Vector, that has aol.source.GeoJSONconfigured and loads the local data insrc/exercises/data/aimag-centers.json. Please style the points with red circles. Please also zoom the map a little bit further out; zoom level4should be fine.
- Our application should now look like in the following image: