Selecting Features
As we've seen in the layers module, we can pull features as vectors and draw them on top of a base map. One of the advantages of serving vector data is that users can interact with the data. In this example, we create a vector layer where users can select and view feature information.
The previous example demonstrated the use of an ol.control.Control on the map. Controls have a visual representation on the map or add DOM elements to the document. An ol.interaction.Interaction is responsible for handling user interaction, but typically has no visual representation. This example demonstrates the use of the ol.interaction.Select for interacting with features from vector layers.
Create a Vector Layer and a Select Interaction
Tasks
- Let's start with the vector layer example from a previous section. Open
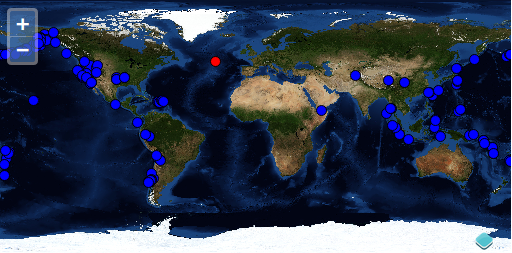
map.htmlin your text editor and make sure it looks something like the following:<!doctype html> <html lang="en"> <head> <link rel="stylesheet" href="/ol.css" type="text/css"> <style> #map { height: 256px; width: 512px; } </style> <script src="/loader.js" type="text/javascript"></script> <title>OpenLayers 3 example</title> </head> <body> <h1>My Map</h1> <div id="map"></div> <script type="text/javascript"> var map = new ol.Map({ interactions: ol.interaction.defaults().extend([ new ol.interaction.Select({ style: new ol.style.Style({ image: new ol.style.Circle({ radius: 5, fill: new ol.style.Fill({ color: '#FF0000' }), stroke: new ol.style.Stroke({ color: '#000000' }) }) }) }) ]), target: 'map', layers: [ new ol.layer.Tile({ title: 'Global Imagery', source: new ol.source.TileWMS({ url: 'http://demo.opengeo.org/geoserver/wms', params: {LAYERS: 'nasa:bluemarble', VERSION: '1.1.1'} }) }), new ol.layer.Vector({ title: 'Earthquakes', source: new ol.source.Vector({ url: '/data/layers/7day-M2.5.json', format: new ol.format.GeoJSON() }), style: new ol.style.Style({ image: new ol.style.Circle({ radius: 5, fill: new ol.style.Fill({ color: '#0000FF' }), stroke: new ol.style.Stroke({ color: '#000000' }) }) }) }) ], view: new ol.View({ projection: 'EPSG:4326', center: [0, 0], zoom: 1 }) }); </script> </body> </html> - Save your changes to
map.htmland open the page in your browser: http://terrestris.github.io/momo3-ws//map.html. To see feature selection in action, use the mouse-click to select an earthquake: